Data & stats template PRO
Bar chart race animation
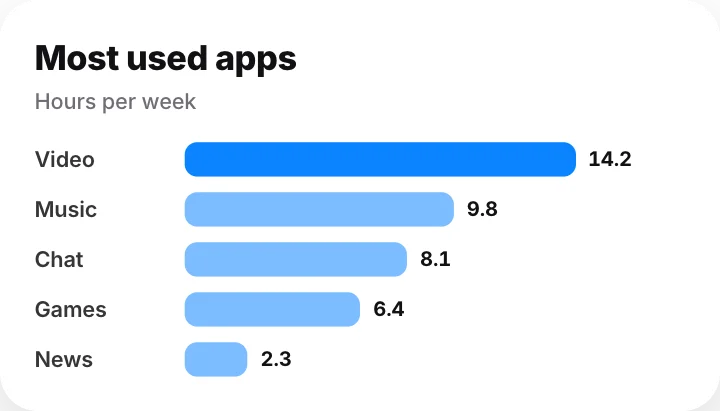
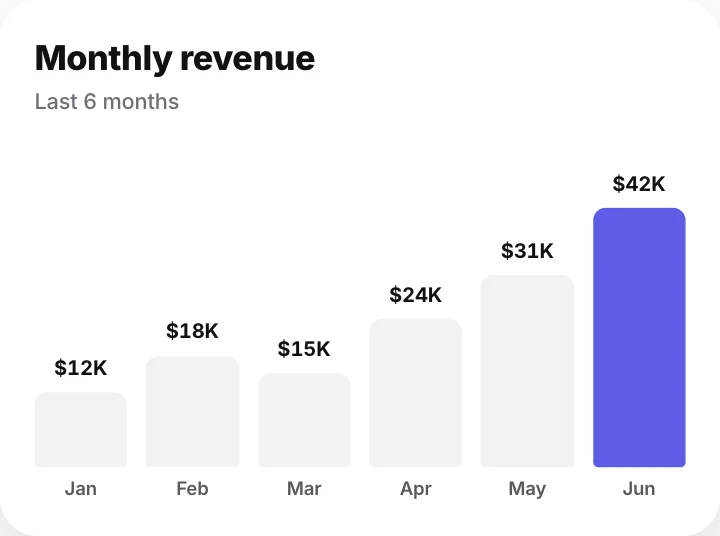
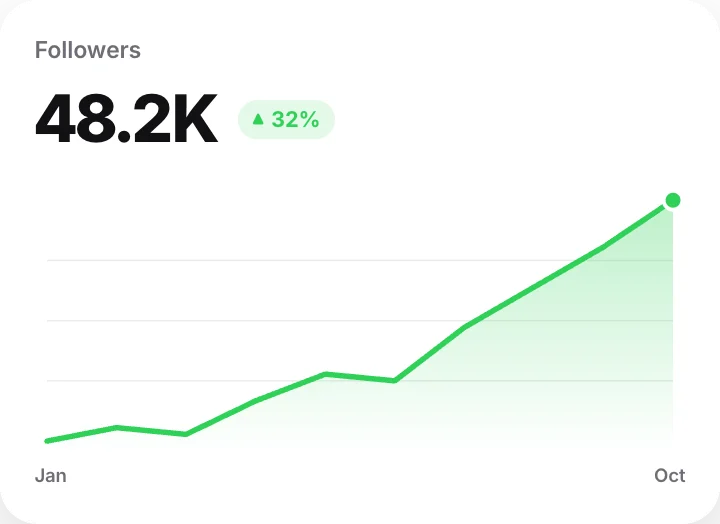
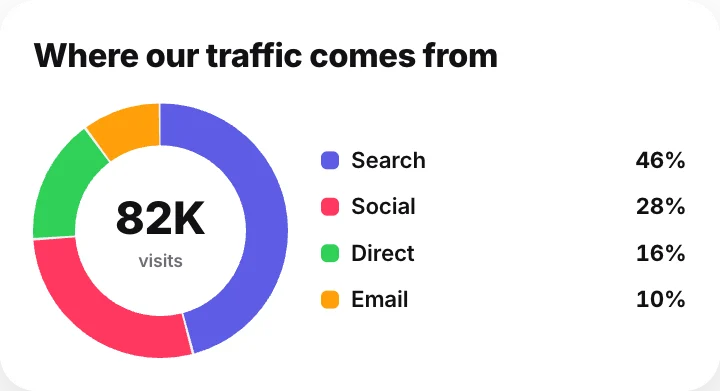
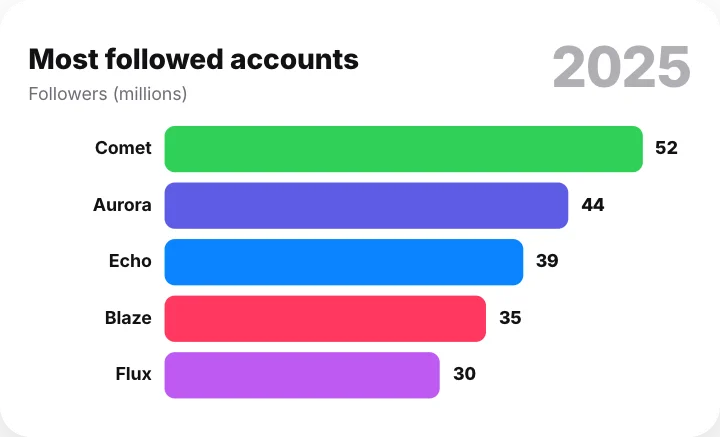
Bars re-rank over the years as values change. A ready-made data & stats animation: change the content, pick the style and motion, then export a video for TikTok, Reels, Shorts or YouTube.
Put it on a gradient, a color, your own image or a transparent background. The example reads “Most followed accounts”, “Followers (millions)”; replace it with your own.
Best for "most followed", "richest" and "biggest companies" ranking videos, where the order changes over time.
Good for: bar race, ranking, race, animated chart.
Open in gizzMotionPro template · $9/month · See pricing
What you can customise
Race
- Title
- Subtitle
- Periods
- Contenders
- Bars shown
- Seconds per period
- Value format (example)
Style
- Theme
- Accent
- Size
- Width
- Card color
Your brand
- Your logo (PNG, transparent works best)
- Your name or @handle
- Show badge
- Badge position
- Badge look
- Badge size
- Background photo (card sits on it)
- Background padding
How to make it
- Open the template. It opens in the free editor in your browser, already animated.
- Make it yours. Edit title, subtitle, periods in the Content tab. The preview updates as you type.
- Pick the format. Choose 9:16 for TikTok, Reels and Shorts, or 16:9 for YouTube, and set the background.
- Export. Save an MP4 to post, a transparent MOV for Premiere Pro, Final Cut or DaVinci Resolve, a WebM for CapCut, or a PNG still.
Export formats
- MP4, 720p or 1080p, 30 or 60 fps
- MOV (ProRes 4444) with transparency
- WebM with transparency (CapCut)
- PNG image
Guides and tools for this template
How to make animated charts and a bar chart race videoTurn your numbers into animated bar charts, line graphs, donuts, rankings and bar chart races for YouTube, Reels and presentations, without Excel or After Effects.What are motion graphics?Motion graphics are animated graphic design: text, shapes, charts, maps and icons that move. Here is what they are, where they are used, and how to make them.Bar chart race makerCreate a bar chart race where bars overtake each other as the numbers change, like the popular "most followed" ranking videos. Runs in your browser.