Data & stats template
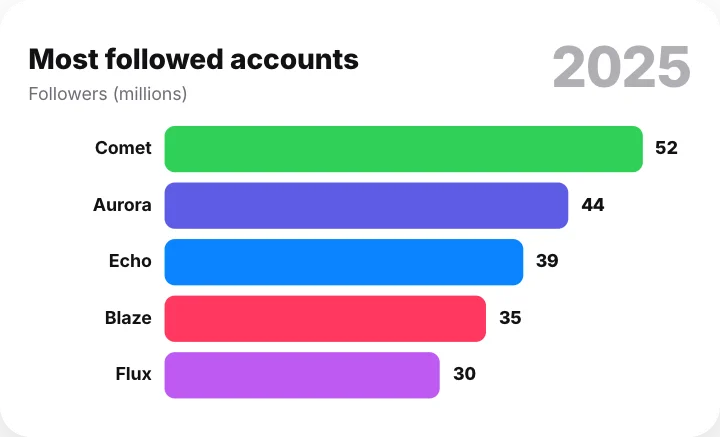
Horizontal bar chart animation
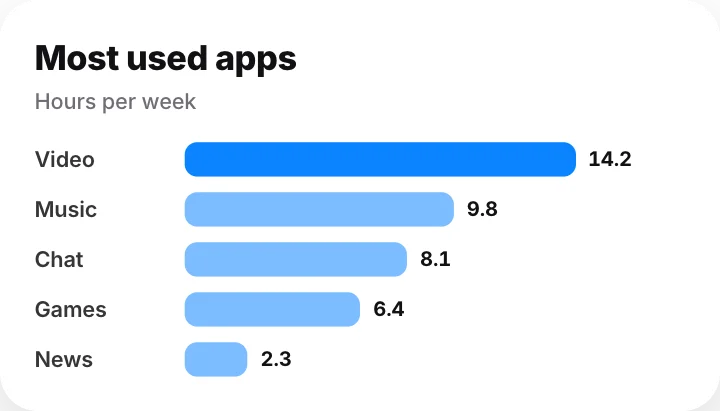
Sorted horizontal bars with values. A ready-made data & stats animation: change the content, pick the style and motion, then export a video for TikTok, Reels, Shorts or YouTube.
Put it on a gradient, a color, your own image or a transparent background. The example reads “Most used apps”, “Hours per week”; replace it with your own.
Good for: chart, bars, ranking, comparison.
Open in the editor, freeFree · No signup · Runs in your browser
What you can customise
Chart
- Title
- Subtitle
- Bars
- Sort biggest first
- Show values
Style
- Theme
- Accent
- Size
- Width
- Card color
Your brand
- Your logo (PNG, transparent works best)
- Your name or @handle
- Show badge
- Badge position
- Badge look
- Badge size
- Background photo (card sits on it)
- Background padding
How to make it
- Open the template. It opens in the free editor in your browser, already animated.
- Make it yours. Edit title, subtitle, bars in the Content tab. The preview updates as you type.
- Pick the format. Choose 9:16 for TikTok, Reels and Shorts, or 16:9 for YouTube, and set the background.
- Export. Save an MP4 to post, a transparent MOV for Premiere Pro, Final Cut or DaVinci Resolve, a WebM for CapCut, or a PNG still.
Export formats
- MP4, 720p or 1080p, 30 or 60 fps
- MOV (ProRes 4444) with transparency
- WebM with transparency (CapCut)
- PNG image